
What to Put on a Subcontractor's Weekly Dashboard (With Examples)
Most weekly dashboards show too much and answer too little. What a subcontractor's should show, where each number comes from, and what to leave off.
Ask a subcontractor about their weekly dashboard and you get one of two answers. There isn’t one, and the owner rebuilds the picture every Monday from Xero, the quotes folder, the estimator’s inbox and texts from site. Or there is one, with thirty numbers, and nobody looks because half were last right in March.
Both end the same way. The owner finds out a quote went quiet, a supplier never priced or a job went a fortnight without an update, too late to act.
A good weekly dashboard is short. It shows what needs doing this week, and nothing else.
What should a subcontractor’s weekly dashboard show?
Start with your Monday questions. For subcontractors who quote from drawings, four groups:
- Quoting: drafts waiting for a check, what’s out, what it’s worth, which quotes need a call.
- Supplier prices: who hasn’t priced, and who’s past due.
- Jobs: which live jobs have no update, and which are over quoted hours.
- Money: invoiced and not paid.
Plus one thing most leave out: whether each source is current. A number from a register last refreshed Thursday is worse than none, because people act on it.
Which numbers belong on it? An example weekly dashboard
An example for a commercial subcontractor with a few live jobs and steady tenders. Every number comes from a record you already keep, and each has an action.
| Section | Number on the dashboard | Where it comes from | How it’s worked out | What you do with it this week |
|---|---|---|---|---|
| Quoting | Quotes awaiting review | Quotes register | Quotes at the stage “Awaiting review” | Check them before their tenders close |
| Quoting | Open quote value | Quotes register | Total ex GST of quotes at Drafting, Awaiting review or Sent | Decide whether you can take on the next tender |
| Quoting | Late follow-ups | Quotes register | Stage is Sent and the follow-up date has passed | Ring the builder |
| Supplier prices | Supplier replies outstanding | Supplier request list | Requests with no reply received | Chase them, or price the gap another way |
| Jobs | Jobs needing an update | Weekly job updates | Live jobs with no update for more than 7 days | Get the supervisor to send one |
| Jobs | Hours against quote | Pricing workbook and timesheets | Hours worked to date against hours quoted, job by job | Ask why before the job runs further over |
| Money | Unpaid invoices | Your accounts | Invoices past their due date | Follow up the builder’s accounts team |
| All | Stale source | Every source above | A source that hasn’t refreshed in the last 24 hours | Check the export ran before you trust the numbers |
Eight rows. Each extra row is one more check before you trust the screen. A figure nobody can trace sends people back to the spreadsheet.
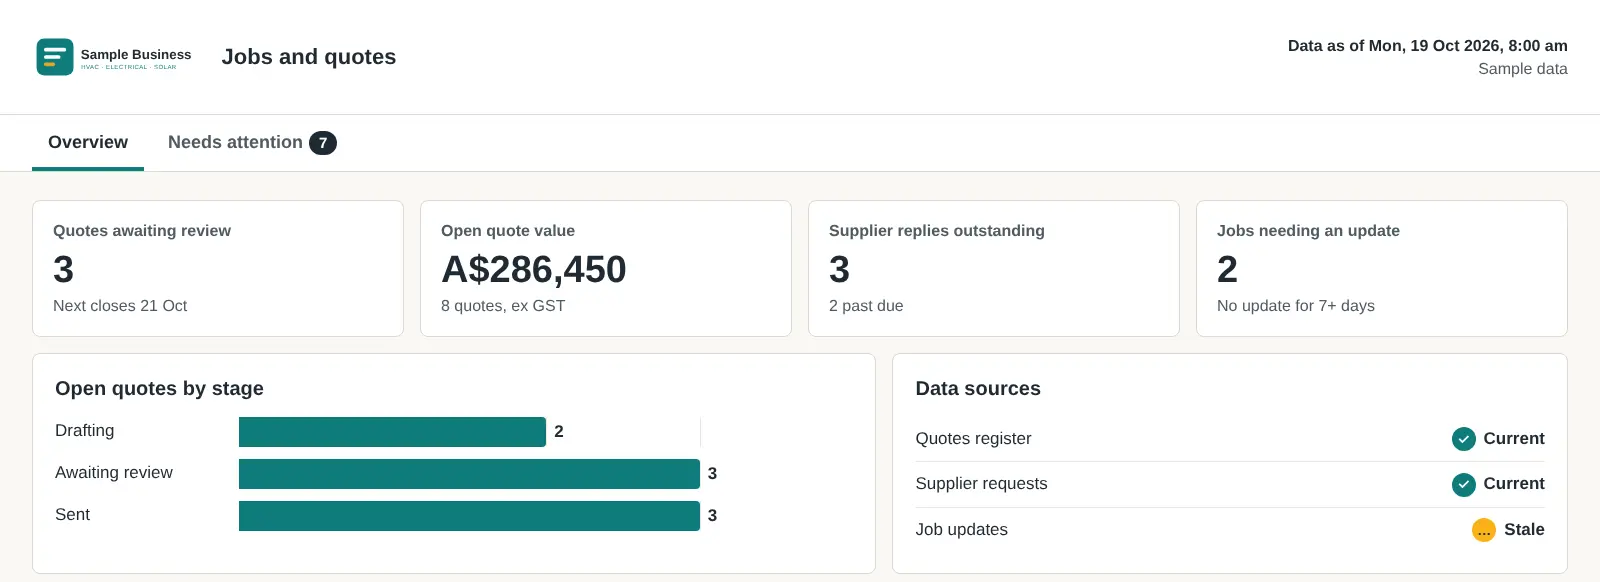 Sample data. A fictional subcontractor’s weekly view: four numbers to act on, open quotes by stage, and one source flagged stale so nobody trusts it blindly.
What does a good weekly dashboard look like?
Four tiles across the top, each a count or value with a reason under it: “Next closes 21 Oct”, “2 past due”, “No update for 7+ days”. Below, one chart and a list of sources with their status.
Three things make it work:
- Every tile is an action. “Supplier replies outstanding: 3, 2 past due” tells you who to ring. “Total quotes this year” doesn’t.
- Every tile shows its source. The data sources panel lists them.
- It says when it’s stale. In the sample, job updates haven’t refreshed in 24 hours, so that figure is flagged.
A second view, “needs attention”, lists each late follow-up, missing price and quiet job with a next step and owner. It’s shown in Excel vs a dashboard for tracking tenders and quotes.
How many numbers should be on a weekly dashboard?
Six to eight. Test each one:
- Would someone act differently this week if it changed?
- Does someone own it?
- Can you trace it to its record?
Any no, and it belongs elsewhere or nowhere.
What should you leave off a weekly dashboard?
Most fail by carrying too much. These belong elsewhere:
| Leave it off the weekly view | Why | Where it belongs |
|---|---|---|
| Year-to-date revenue | Doesn’t change what you do on Monday | Monthly review with the accountant |
| Win rate | Moves slowly, needs decided quotes to mean anything | Monthly or quarterly, by builder and job size |
| Every job’s full cost breakdown | Too much detail for a weekly scan | The job’s own report, opened when the hours flag it |
| Numbers typed in by hand each week | Out of date the moment someone’s busy | Replace with a number worked out from the source |
| Anything nobody owns | Nobody acts on it | Off the dashboard until someone does |
Win rate matters, just not weekly. How to work it out, by count and value: the quote tracking dashboard.
How do you run the weekly check?
Same order every week, so it’s a habit:
- Check the sources. Fix anything stale first.
- Clear the review queue. Earliest closing date first.
- Make the calls. Late follow-ups to builders, missing prices to suppliers.
- Chase quiet jobs. Each gets an update from its supervisor.
- Look at the hours. A job over quoted hours gets a question now.
The owner shouldn’t gather any of it. The numbers are there when you sit down.
Where do the numbers come from without double handling?
From the systems you run, entered once. Quotes in the register. Supplier requests in a list. Invoices in Xero. Hours from wherever the crew records them.
That last one matters. One operator would rather get a weekly email than make everyone learn a new app. A good dashboard works from what people already enter. The wider version, Xero, Procore and a crew app included: how to stop double handling with one dashboard.
What about the quotes themselves?
A dashboard shows what’s waiting and what’s gone quiet. It can’t make quotes faster to prepare or check. That’s where most time goes.
That’s our estimating plugin. It fills your BOQ in your layout with drawing, page and revision on every line, prices it from your rates and drafts the quote on your letterhead. Your estimator checks instead of redoing. Nothing goes out until you approve.
How do we set up a weekly dashboard for you?
We set up dashboards around your weekly checks: quotes awaiting review, missing supplier replies, jobs needing an update. It starts after your estimating setup is delivered, using agreed implementation hours under its own proposal. What it reads from depends on what you run; we’ll go through yours on the call.
If Monday starts with rebuilding last week’s numbers from four places, book a call. Bring the spreadsheet you use now, whatever shape it’s in.
Frequently asked questions
What should be on a subcontractor's weekly dashboard?
Quotes awaiting review, open quote value, overdue follow-ups, missing supplier prices, jobs without an update, hours against quote, unpaid invoices, and whether each source refreshed.
How many numbers should a weekly dashboard have?
Six to eight you'd act on this week. Every extra number is one more to check before you trust the screen.
What should I leave off a weekly dashboard?
Anything you can't act on this week, nobody owns or can't be traced. Year-to-date totals and slow charts belong in a monthly review.
Do I need new software for a weekly dashboard?
No. It reads what you already keep: quotes register, supplier requests, job updates, your accounts. Each number entered once, where it belongs.
Is the dashboard part of the estimating plugin?
No. The plugin prepares the BOQ, pricing workbook and draft quote. Dashboards are separate work we can agree after your estimating setup is delivered.
Want to see what needs your attention first?
The App reads from your job system, inbox and Xero and shows what needs a decision each week. It is in build, and the waitlist is open. Estimating is live today as the plugin.